LUCID DDoS Dashboard
2025Real-time AI-powered dashboard for detecting and mitigating DDoS attacks using a lightweight Convolutional Neural Network (CNN).
The Problem
Distributed Denial-of-Service (DDoS) attacks remain one of the most significant threats to online service availability. Traditional intrusion detection systems often rely on static signature matching, which struggles to keep pace with novel attack vectors, or they employ complex machine learning models that are too resource-intensive for real-time edge deployment.
During Capture The Flag (CTF) competitions and live server operations, we needed a way to monitor network traffic in real-time without overwhelming the host system’s CPU and memory, while still accurately identifying malicious flows before they caused downtime.
The Solution
I built the LUCID AI DDoS Monitoring Dashboard, a comprehensive web application that wraps the LUCID (Lightweight, Usable CNN in DDoS Detection) framework. It provides live, flow-based analysis of network traffic and immediate tools for environment control.
Try the Live Demo: https://dash.secops-ensaf.com/
Original Research Paper: LUCID: A Practical, Lightweight Deep Learning Solution for DDoS Attack Detection (IEEE)
The system is split into two primary panels: DDoS Monitor (AI Analysis) and System & Network (Control/Operations).
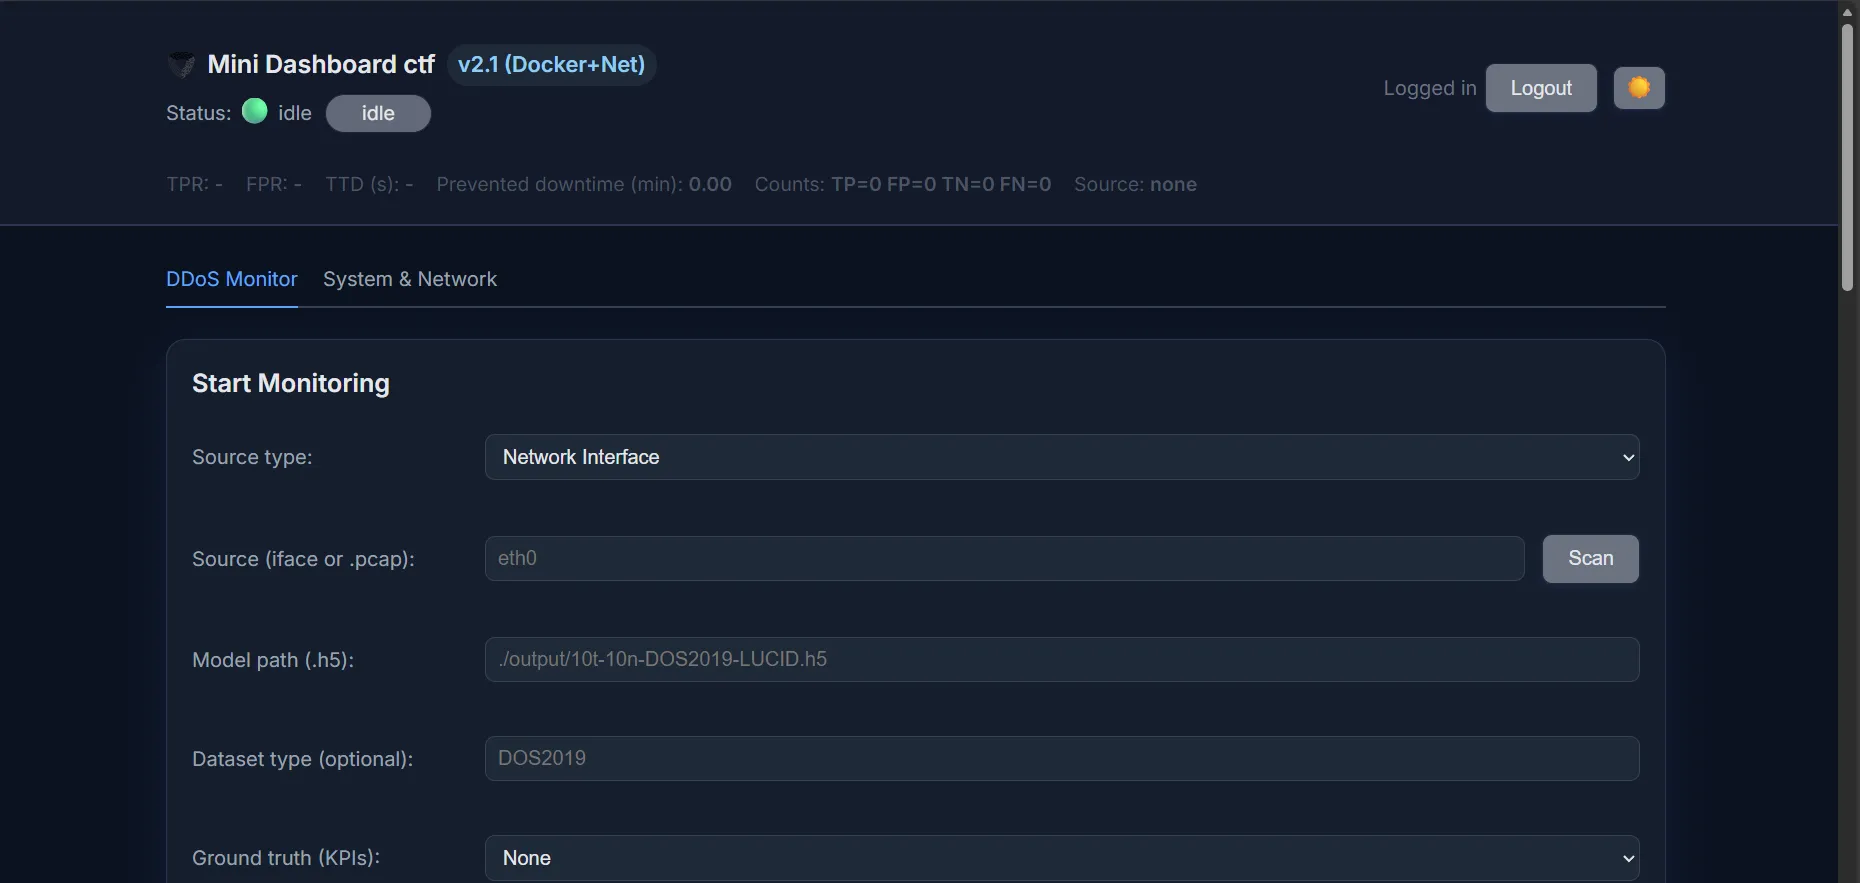
1. Real-Time AI Monitoring (LUCID Framework)
At the core of the application is a 1D Convolutional Neural Network (CNN). Unlike models that analyze full payloads, this CNN processes specific fragments of network flows over fixed time windows (e.g., 10 seconds).
- Data Flow Pipeline: Capture (via
tshark/pyshark) → Feature Extraction → Flow/Window Assembly → CNN Predict → Metrics & Alerts. - Live Inference: The normalized data is fed into the lightweight CNN, which classifies flows as benign or malicious with incredibly low latency (< 20ms per window).
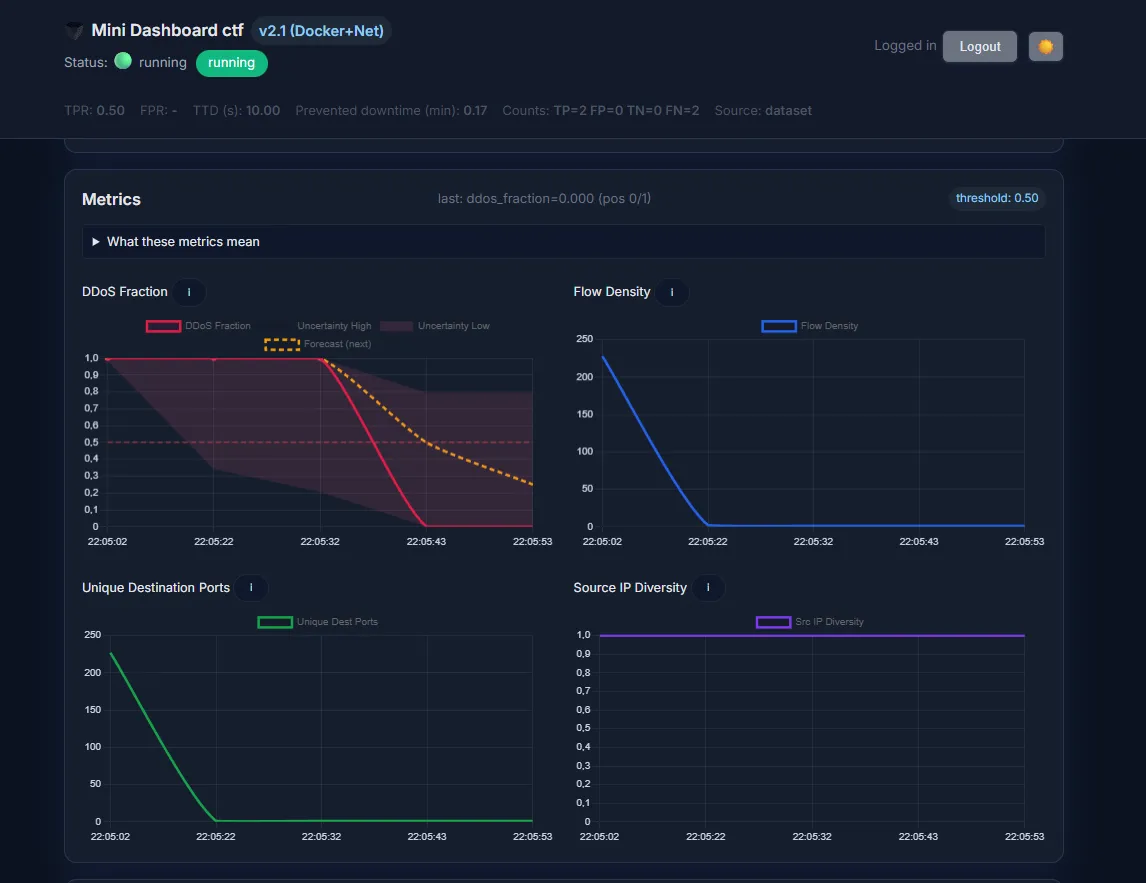
- Deep Metrics Visualization: The frontend consumes a WebSocket stream to display rolling charts of the “DDoS Fraction” (percentage of malicious flows), Flow Density, Unique Destination Ports, and Source IP Diversity.
2. Advanced Mitigation Control
The dashboard implements a tiered, robust framework for managing network exceptions and mitigating attacks without manual intervention:
- Hysteresis & Cooldown: Customizable policy settings require multiple consecutive alert windows before automated mitigation is applied, preventing false positives.
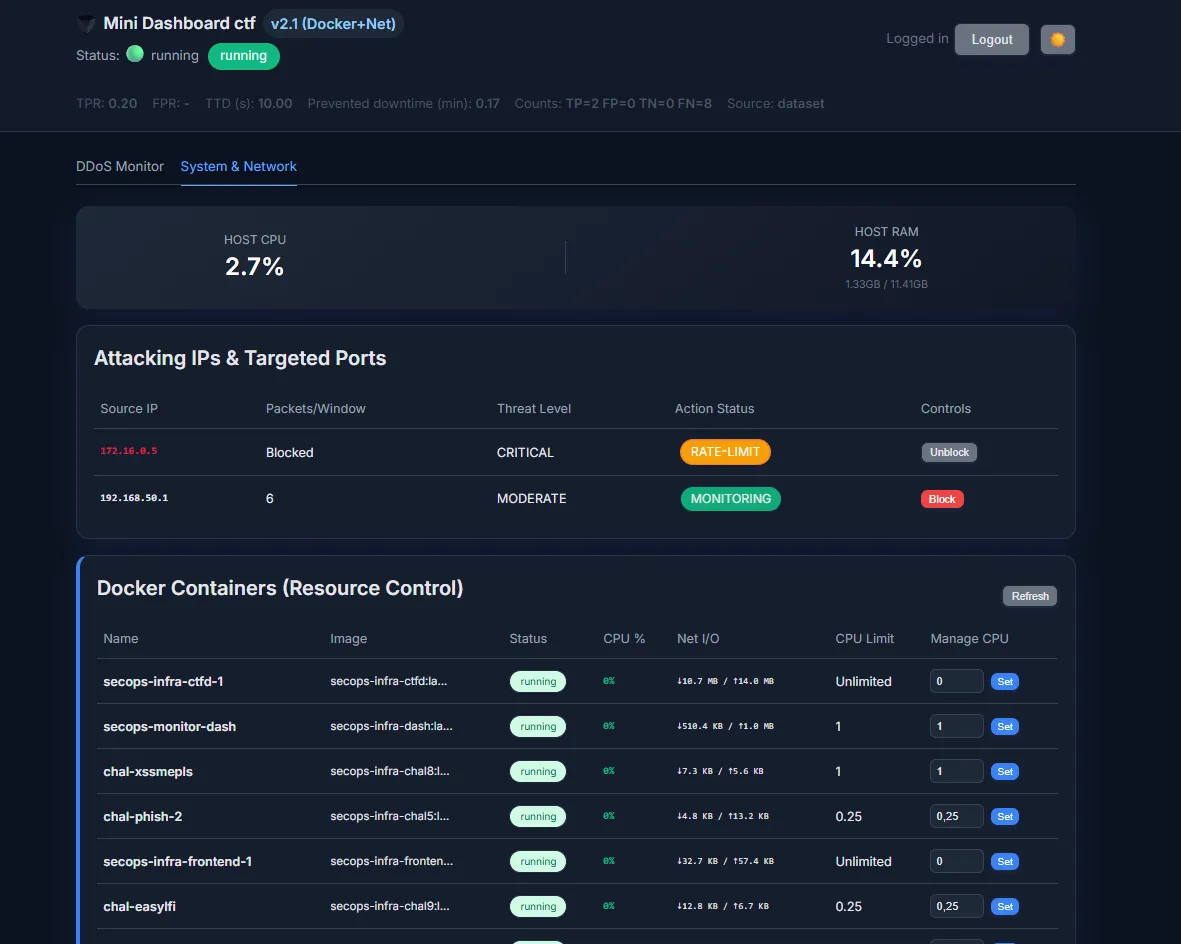
- Tiered Action: Offending source IPs are escalated from a Monitor state, to RATE-LIMIT, and finally to a complete BLACKHOLE block.
- Allowlist: Legitimate traffic (like health checks or trusted IPs) can be permanently excluded from blocking and monitoring.
3. Infrastructure & Docker Control
To support rapid response in a containerized environment, I integrated direct infrastructure management into the dashboard by mapping /var/run/docker.sock:
- Resource Visibility: Provides real-time metrics (CPU %, Net I/O) for all running containers within the shared Docker network.
- Dynamic CPU Limiting: Operators can dynamically adjust the CPU allocation (
NanoCPUs) for any running container directly from the web interface, ensuring the detection service itself is not starved by a runaway process during an attack.
4. Deployment Architecture
The dashboard is designed for high portability and can be deployed via Docker Compose on a Linux VPS or natively on cloud platforms like Render.
- Docker Compose: Utilizes volume mapping for hot-reloading code and persisting PCAP evidence files.
- Native Environments: Configured custom build scripts to ensure system-level dependencies like
tsharkare installed within the application’s runtime environment, allowing offline PCAP replay and live network sniffing.
The Results
The LUCID Dashboard successfully bridged the gap between academic deep learning research and practical, operational security for our infrastructure.
- High Accuracy: Validated against the CIC-DDoS2019 dataset, the underlying CNN achieved a 99.47% accuracy, a 0.994 F1-Score, and a True Positive Rate (TPR) of 0.991.
- Operational Efficiency: The entire service runs with a minimal footprint (< 500MB RAM), capable of processing over 10,000 flows per window without lagging.
- Rapid Response: The system achieves a Time To Detection (TTD) of less than one 10-second window, enabling automated mitigation before a server can be fully overwhelmed.